Gold Plunges 24%: Q2 2026 Sees the Biggest 13-Year Pullback, and the Market Logic Has Quietly Reversed
Keywords: gold prices, spot gold, drawdown, stronger dollar, Fed policy, asset allocation
Introduction: A Plain Sentence, a Sharp Entry Point
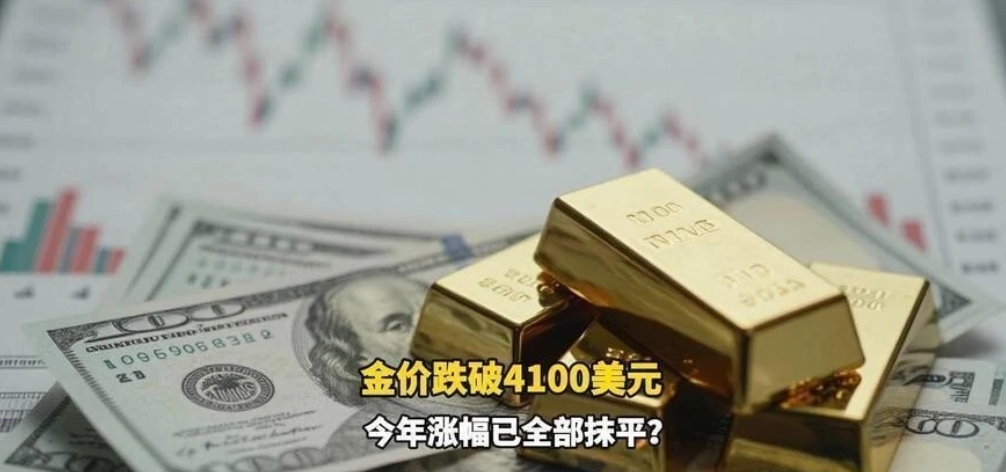
“It sounds like a plain sentence, but in today's gold market it hits the key point.” When a trader casually described the gold market in mid-July like this, few people realized that it reflected a structural shift that had been building for months. On July 10, 2026, spot gold fell below the $4,100/oz round number, touching a low of $4,085 intraday. From the record high of $5,405 at the start of the year, the drawdown has exceeded 24%, officially pushing gold into technical bear-market territory. More alarming still, gold fell 14.2% in the second quarter alone, the worst quarterly performance since the 2013 “gold crash.”
Gold, once regarded by countless investors as the “ultimate safe haven,” is going through a deep trust crisis. Has the market logic already reversed? And how should investors recalibrate their asset allocation?
1. From 5405 to 4085: The Structural Turning Point Behind the Swings
At the start of 2026, the gold market was still wrapped in optimism. Repeated geopolitical shocks, continued central-bank buying, and high inflation expectations drove gold to a record high of $5,405 in mid-January. At the time, some even predicted that gold could hit $6,000 within the year.
But in the second quarter, things turned sharply. Starting in April, U.S. economic data kept beating expectations, nonfarm payrolls stayed above 300,000 for three straight months, and core CPI unexpectedly rebounded to 3.8% in May, breaking the market's assumption that inflation would fall quickly. The Fed quickly changed its policy tone, moving from “pause hikes” to a hawkish path of “two more hikes.” The dollar index then surged to 112.5, the highest since 2022.
The negative relationship between gold and real U.S. rates was reactivated. When the 10-year TIPS yield jumped from 1.2% to 2.1%, the cost of holding gold rose sharply, accelerating the liquidation of speculative longs. As of July 10, CFTC data showed net long gold futures positions had fallen to 128,000 contracts, nearly 60% below the start of the year, the lowest level since the outbreak of COVID-19 in 2020.
2. What Does a 14.2% Quarterly Drop Mean?
The 14.2% drop in Q2 ranks among the largest in the past two decades, behind only Q2 2013's 23% collapse (when taper fears triggered a rush to exit after the Fed hinted at reducing QE) and Q4 2008's 17% fall (the liquidity crisis sparked by Lehman Brothers' collapse). But this time is fundamentally different: it was not caused by an instant freeze in liquidity, but by a systemic shift in the fundamental logic.
The 2013 crash was a panic reaction to the Fed's exit, but central banks were still net buyers of gold then. The 2026 decline combined three deeper contradictions:
- Weak physical demand: The People's Bank of China paused gold buying for three straight months, and India's gold imports fell 28% year over year in June. Both major consumption engines stalled at once.
- ETF outflows continued: The world's largest gold ETF, SPDR Gold Trust, saw net outflows of 92 tons in Q2, the largest quarterly outflow since 2020.
- Alternative assets rose: Bitcoin climbed to $120,000 over the same period, and some inflation-hedge capital shifted from gold to crypto and other alternative assets.
When speculative money, physical demand, and ETF flows all leave at the same time, gold loses its most important support.
3. Fed Policy: Gold's Biggest “Enemy”
The main driver of this gold selloff is clearly the Fed's monetary tightening. Although markets were betting in late 2025 that the Fed would cut rates four times in 2026, the U.S. economy proved far more resilient than expected. In the first half of 2026, GDP growth held at an annualized 2.4%, the core PCE measure rose back to 3.1% in June, and services inflation remained stubbornly sticky.
After the June FOMC meeting, Fed Chair Powell made it clear: “We still have work to do, and we do not rule out another hike in September.” That statement completely reversed market expectations for cuts. CME Fed funds futures showed the probability of a September hike jumping from 32% a month earlier to 78%.
More importantly, rising real rates squeezed gold's logic as a zero-yield asset. Gold itself pays no interest, so when real rates are positive and rising, the opportunity cost of holding gold rises sharply. Once 10-year TIPS yields broke above 2%, gold's allocation value weakened significantly. History shows that when real rates are above 2%, gold is highly prone to quarterly drawdowns of more than 15%.
4. How Are Global Investors Responding?
As gold keeps falling, different types of investors are responding in different ways.
Central banks: While the People's Bank of China has paused purchases, some emerging-market central banks such as Poland and Turkey are still adding to gold reserves in an effort to diversify FX reserve risk during a stronger-dollar cycle. But central-bank buying has already dropped from around 60 tons a month to about 30 tons, which is not enough to offset the massive ETF outflows.
Institutional investors: Pension funds and sovereign wealth funds are reassessing gold's role as a tail-risk hedge. Some large funds have cut their gold allocation from 8% to 5% and instead added more TIPS and REITs in search of higher real returns.
Retail investors: The retail gold market is seeing panic selling. In early July, buyback volume for gold bars at Shenzhen's Shuibei jewelry market jumped 120% month over month; India's local gold premium briefly hit a three-year low; and gold banks in South Korea saw lines of people selling gold.
For investors who still hold gold, the key question now is not “should I sell?” but “where could it bottom out?” On the technical side, $4,085 sits near the long-term uptrend line since 2024, but the 5-day and 10-day EMAs have both crossed bearish, so the short-term weakness is hard to reverse. If gold breaks below the $4,000 round number, the odds of testing $3,800 or even $3,600 rise materially.
5. Outlook: Where Is Gold's “Bottom”?
Whether gold can stop falling and rebound depends on three variables.
The first is the dollar index. If the dollar index moves above 115 and then pulls back, gold may get a temporary breather. But U.S. economic strength, weak European growth, and the Bank of Japan's continued easing all suggest the dollar is unlikely to weaken in trend terms in the near term.
The second is the inflation outlook. If core PCE falls below 2.8% in the second half, the market may reprice rate-cut expectations, which would directly support gold. But oil recently surged to $95/bbl due to the Iran crisis, which could make inflation stickier and prolong gold's adjustment period.
The third is geopolitical risk. There are still several hot spots around the world, but markets seem to have developed immunity to the “new normal” of geopolitical risk. Only a sudden black-swan event would allow gold to regain its safe-haven shine. Otherwise, gold prices will remain under pressure in the backdrop of tighter liquidity.
Conclusion: Beyond the Entry Point, a New Market Logic
Back to the plain sentence from the opening—each gold selloff on the screen looks like a price correction on the surface, but in essence it is a reset of market logic. From 5405 to 4085, this 24% drawdown was not an accident, but the result of three forces acting together: the Fed, the dollar, and real interest rates.
For investors, what matters now is not choosing between “buy the dip” or “liquidate everything,” but re-understanding the macro environment gold sits in. When the gold faith of “buy and hold” is broken, and the narrative of “fighting inflation” is eroded by higher rates, gold may be returning to its ancient nature—an asset that demands caution, not blind enthusiasm.
At the market's entry point, sometimes the most ordinary words hide the deepest truth.